143 Years of Weather in Sydney, Nova Scotia in an Online, Interactive Dashboard
I've been working hard on a bunch of these weather dashboards for places in Nova Scotia, learning while cobbling together data from Environment Canada that was anything but straightforward and convenient. I'm sure they have their reasons for what they do, though, so I'll stick to using it.
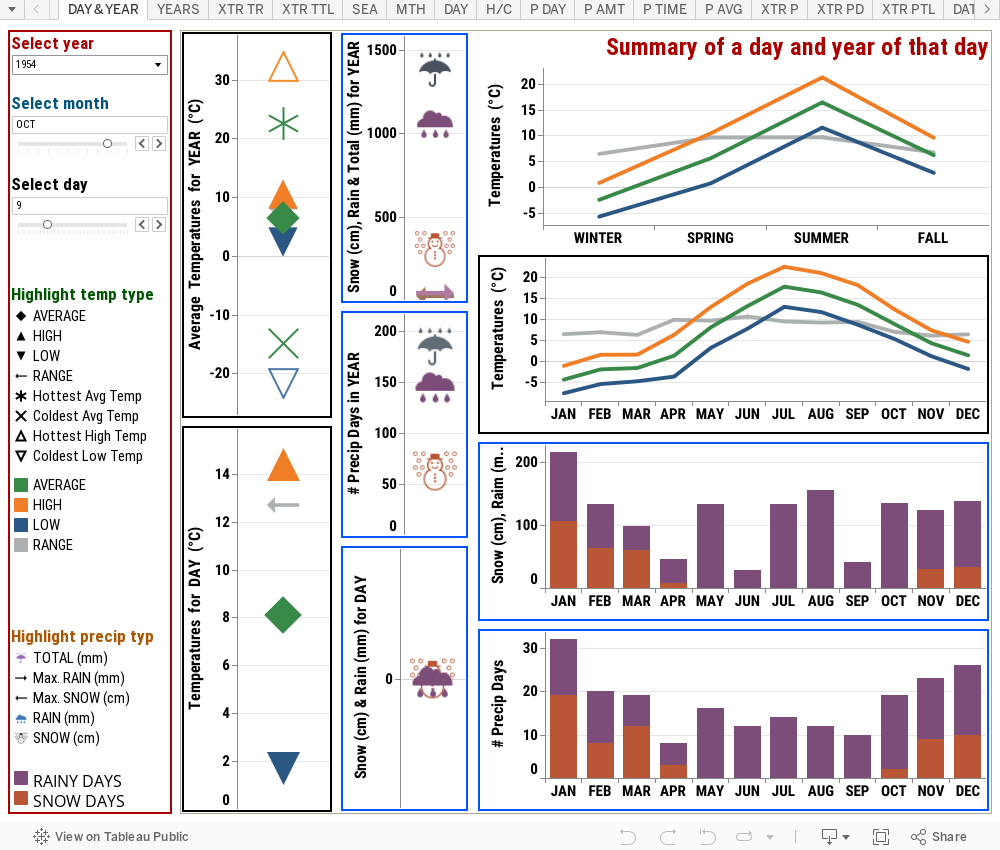
Sydney had the most complete data, by far, among the places in Nova Scotia, and for the longest period as well. As a result, I'm posting the weather dashboard for it first. Play around with the sliders, hover over things, click on things, etc. and see what you get. Once you figure out where everything is, make up questions to ask yourself to try and figure out, like what were the hottest 5 years between 1923 and 1976? See if the temperature has been getting warmer? Or just look for things like years where the average daily low was below zero degree Celcius! How many people do you think would have guessed that?
Those living there would probably guess it rained and/or snowed close to every second day, though, and that if rained and/or snowed everyday, it'd be a couple of millimetres rather than some decimal. Next time they get couple of millimetres' rain or centimetres' worth of snow, they should think how that could be their year if their rain and snow were spread out evenly!
Enjoy!


Comments
Post a Comment